
Plots the counts from dig_tally() with a title, a subtitle that says
what is shown, and alt text for screen readers. Genres, styles,
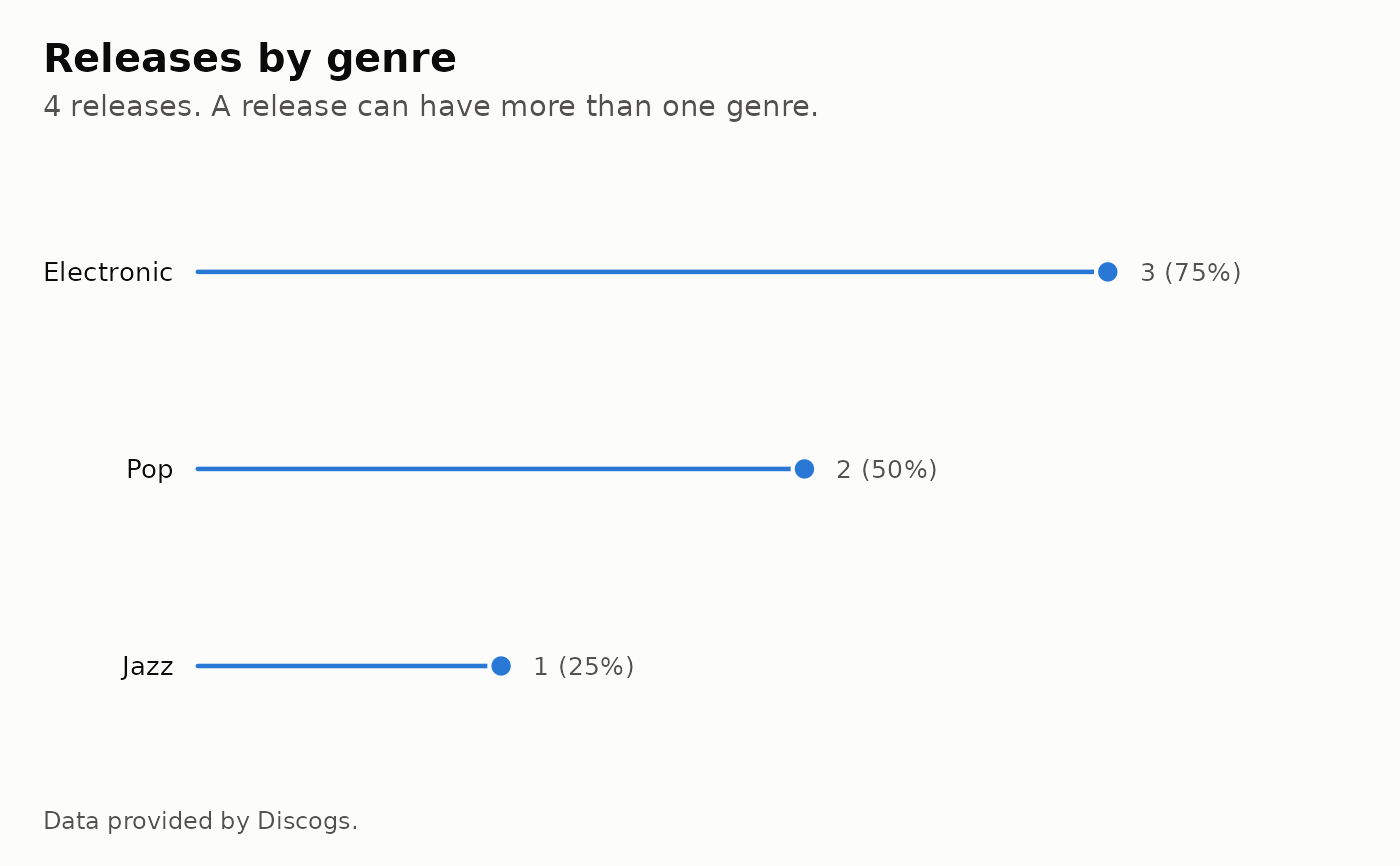
formats, labels, artists, roles and countries are drawn as ranked
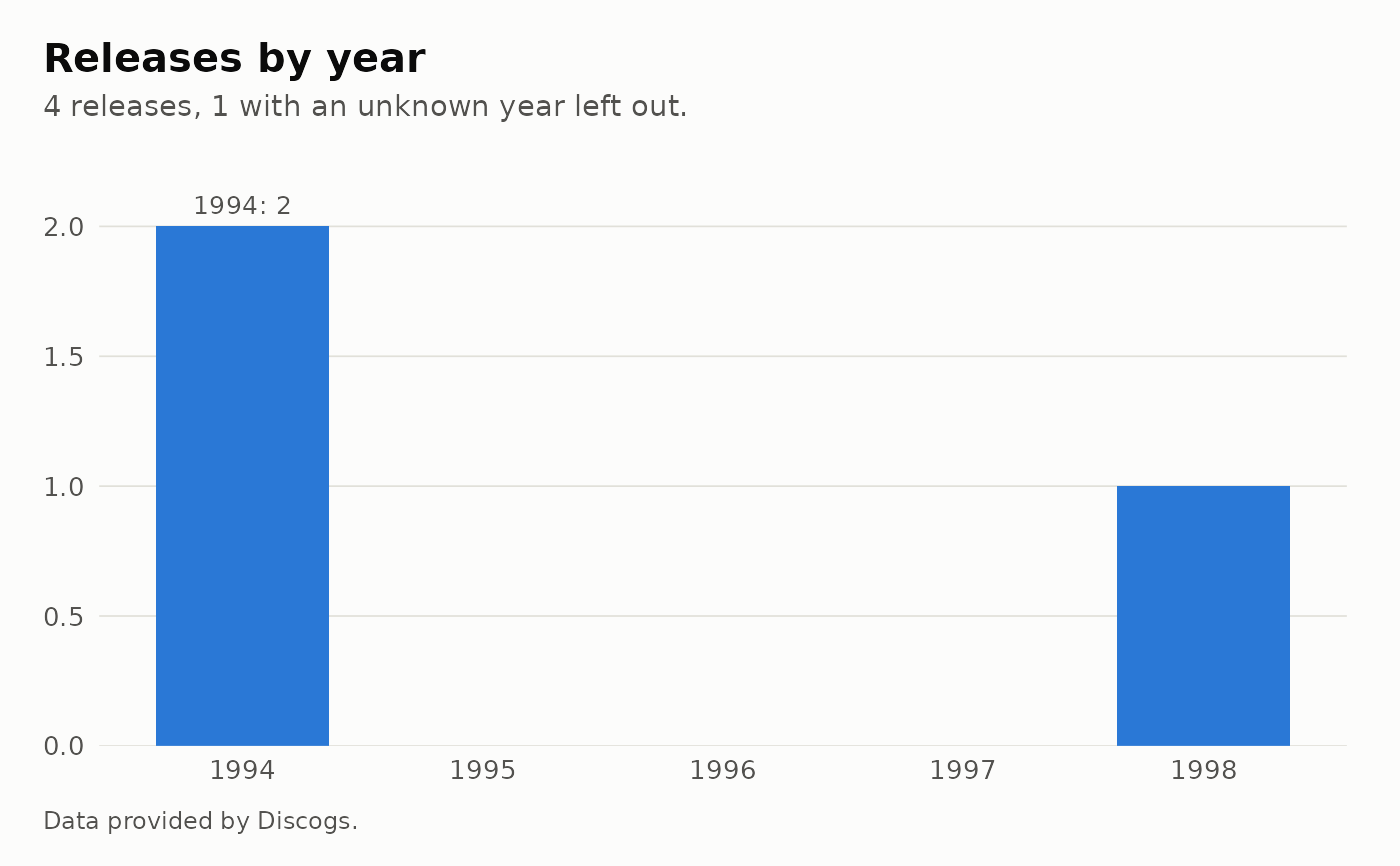
lollipops with the count and share at each tip. Decades are columns
with their counts, years are columns with the busiest year marked, and
by = "added" is a line of the running total. Plotting needs the
ggplot2 package.
Usage
dig_plot(
  x,
  by = c("genre", "style", "format", "label", "artist", "role", "country", "decade",
    "year", "added"),
  n = 10,
  unique = FALSE
)
Arguments
- x
A tibble returned by one of the functions listed in Details.
- by
What to count by:
"genre","style","format","label","artist","role","country","decade","year"or"added", the month a copy was added.- n
The number of values to keep for all but years, decades and months. The rest are counted together as
"Other".Infkeeps all values.- unique
If
TRUE, each release counts once, however many copies of it there are.
Details
The colours have a contrast of at least 3:1 with the background, and
every value that is not on an axis is written next to its mark, so no
value depends on colour alone. The title, subtitle and alt text can be
changed with ggplot2::labs().
Every plot has the caption "Data provided by Discogs.", which the API
Terms of Use require next to any data from 'Discogs'. Where you publish
a plot, link the caption to the 'Discogs' page with the data. Plots of
a collection or wantlist show Restricted Data, see dig_collection().
Examples
shelf <- tibble::tibble(
release_id = c(1, 1, 2, 3),
year = c(1994, 1994, 1998, NA),
genres = list(c("Electronic", "Pop"), c("Electronic", "Pop"), "Electronic", "Jazz")
)
dig_plot(shelf, "genre")
 dig_plot(shelf, "year")
 if (FALSE) { # interactive() && rlang::is_installed("ggplot2")
collection <- dig_collection("username", all = TRUE)
dig_plot(collection, "decade")
dig_plot(collection, "added")
dig_plot(dig_artist_releases(1, all = TRUE), "role")
}