
Skip to contents

A plain theme for figures in papers and theses: white background, light grid without minor lines, bold left-aligned facet labels, a title that starts at the left edge of the figure and the legend at the bottom. Built in Advanced Statistics, session 11. ggplot2::theme_set(theme_paper()) makes it the default.
Usage

theme_paper(base_size = 11, base_family = "")

Arguments

base_size

Base font size, in points.

base_family

Base font family.

Value

A ggplot2 theme.

Examples

library(ggplot2)
library(simling)
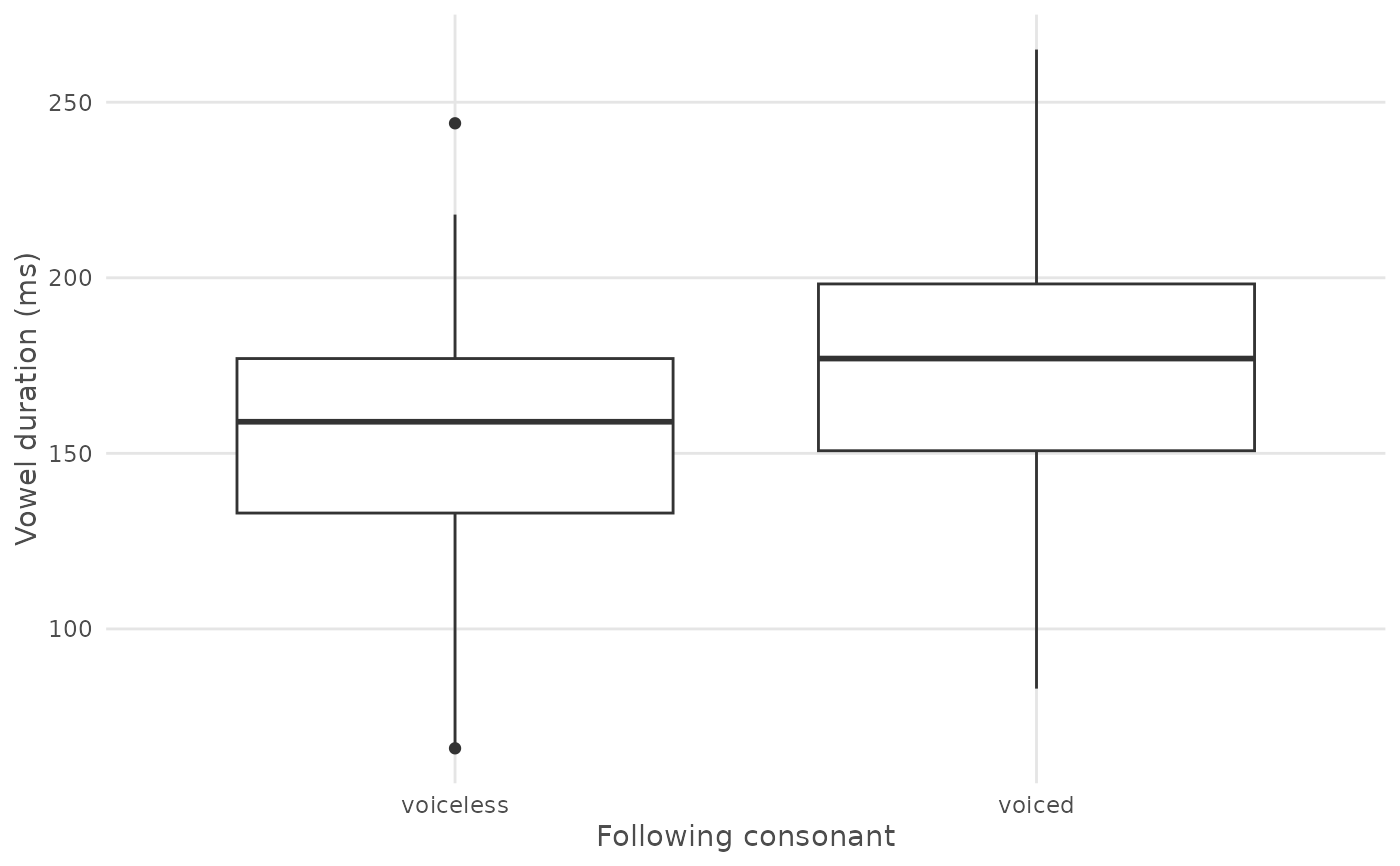
ggplot(vowel_duration, aes(x = voicing, y = duration)) +
  geom_boxplot() +
  labs(x = "Following consonant", y = "Vowel duration (ms)") +
  theme_paper()